What are Infographics?
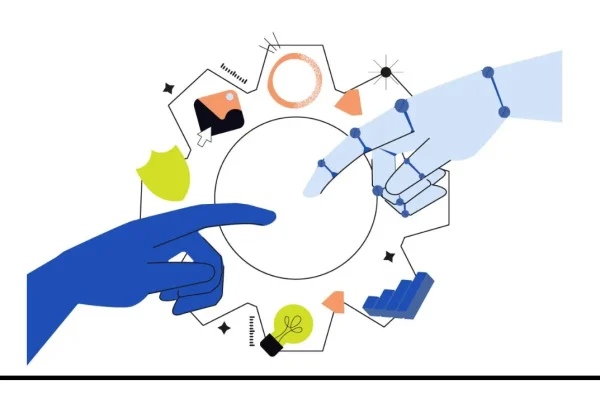
An infographic is a visual representation of information. An infographic uses graphic design, charts, and other visual elements in order to provide concise information on a specific topic in an easy-to-read manner. Keep reading to learn more about infographics and how to create infographics for your brand!
Why use Infographics?
Infographics are used in a variety of different industries. Non profit organizations, technology, education, real estate, etc. Almost every kind of business can use infographics to communicate information to their staff, customers, and business partners. Here’s why your brand should consider using infographics in your digital marketing strategy:
-
The majority of people consider themselves “visual learners”
-
Less than 30% of the text on web pages is read
-
Humans process images much faster than they do text
-
If constructed properly, infographics have the ability to grab attention, engage an audience, portray credibility and thought leadership, educate, and inform
-
Infographics can enhance your SEO, grow your brand awareness, build trust with customers and prospects, and help your business make more sales
Who Creates Infographics?
On-brand design and conveying a clear and meaningful message to your audience is key to having a successful infographic strategy. The content creation experts at 90 Degree Design are here to help! For the DIY content creators out there, Canva is a simple to use tool to create great infographics!
How to Create Infographics:
-
Understand Your Audience
- Define who you’re targeting with your infographic. What do you know about them? Consider their interests. What kind of information is important to them?
-
Select Your Topic
- Now that you know who you’re targeting, select a topic that your audience will care about. Make sure that your topic is relevant, provides accurate information, and limit yourself to one topic per infographic.
-
Simplify Your Content
- Keep text concise and to the point. The idea is to portray your information in an organized and simple manner.
-
Make it Stand Out
- Use bold and complimentary colors (incorporate your brand colors), include fun visual elements, and catchy headlines.
-
Make it Easy to Read
- Information should flow. Use headlines to organize key points. Use 3 fonts maximum, include plenty of white space, and minimal clutter.
-
Don’t forget to add your logo!
Where Should I Post My Infographic?
Social Media is the number one place where we recommend using your infographic. Instagram is a visual social media platform. So, that’s an excellent place to start. Many Instagram and Facebook users will not want to spend time reading a lengthy caption, and if your image doesn’t immediately grab their attention, they will keep scrolling. Infographics are great ways to grab user’s attention, get them to read your content, engage with your brand, and earn their following by providing relative and informative information.
In our Instagram Algorithm Article, we discussed how Saves and Shares are more important than ever. Informative and educational content is much more likely to be saved or shared. It doesn’t end with social media. Infographics also make great website content, email marketing, print marketing, training materials, and more!
When Should I Post My Infographic on Social Media?
Now! Ok, maybe not “right-now”… When posting your infographic on your brand’s social media, look at your insights to see when your accounts receive the highest levels of engagement. Try to post during peak times in order to get the best results.


